 Fraud & risk
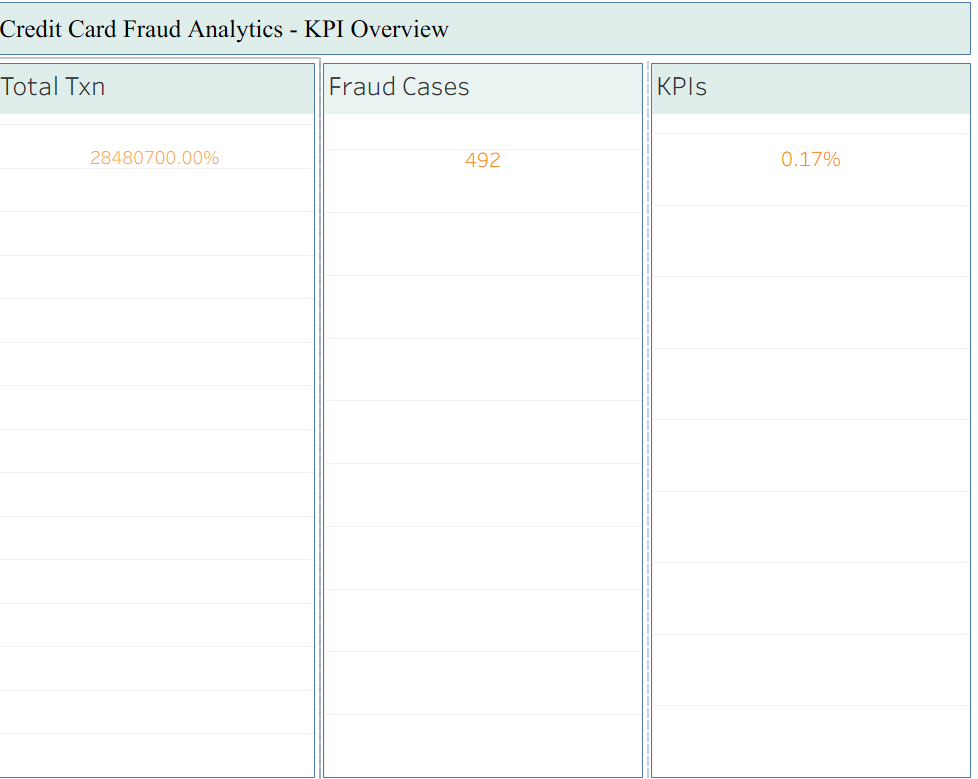
Credit Card Fraud Analytics
End-to-end fraud analytics on credit card transactions, including feature engineering, model building and evaluation, and interpretation of fraud risk patterns for stakeholders.
View GitHub repo →I collect, clean, analyse and visualise data so product, operations and leadership teams can make confident, strategic decisions.
From basic status reporting to advanced analytics and predictive models – I build end-to-end solutions that teams actually use.
Examples from my work in credit card analytics, retail sales, Covid-19 reporting, telecom churn, marketing experiments and data quality pipelines.
I support every step of the analytics lifecycle – from capturing the right data, to process improvement in pipelines, to UX/UI-friendly dashboards and communication with stakeholders.
I start with the questions and decisions that matter, then map the data we have and the data we need – making sure the basics are captured correctly.
Using SQL, Python and cloud warehouses, I build reliable models and analyses that stand up to scrutiny and can be reused by the wider team.
I design UX/UI-friendly dashboards and reports that make complex statistics easy to understand and act on, for both technical and non-technical audiences.
A data analyst who loves pairing solid statistics with clean UX/UI and clear communication – so data becomes a strategic asset, not just a report.
I’m Likhith, a consulting-style data analyst with experience across credit cards, banking and hospitality. I specialise in building end-to-end analytics solutions: from defining what to measure and capturing the data, to advanced analytics, predictive models and dashboards that are easy for stakeholders to use.
My work blends strategy, statistics and design. I’m comfortable speaking with both engineering and business teams, turning their questions into data models and visual stories. I spend a lot of time on process improvement – simplifying pipelines, improving data quality and making sure metrics stay consistent across reports.
Day-to-day, I work with SQL, Python, Power BI, Tableau, GA4, Snowflake and Google BigQuery. I care about accessibility, UX/UI for dashboards, and basic to advanced analytics that genuinely support decisions. The outcome I aim for is simple: clear status, shared understanding and collaborative decisions that move the business forward.
A sample of my analytics work. Each project includes end-to-end thinking: data strategy, integration, analysis, UX/UI design and clear communication of insights.
Fraud & risk
End-to-end fraud analytics on credit card transactions, including feature engineering, model building and evaluation, and interpretation of fraud risk patterns for stakeholders.
View GitHub repo →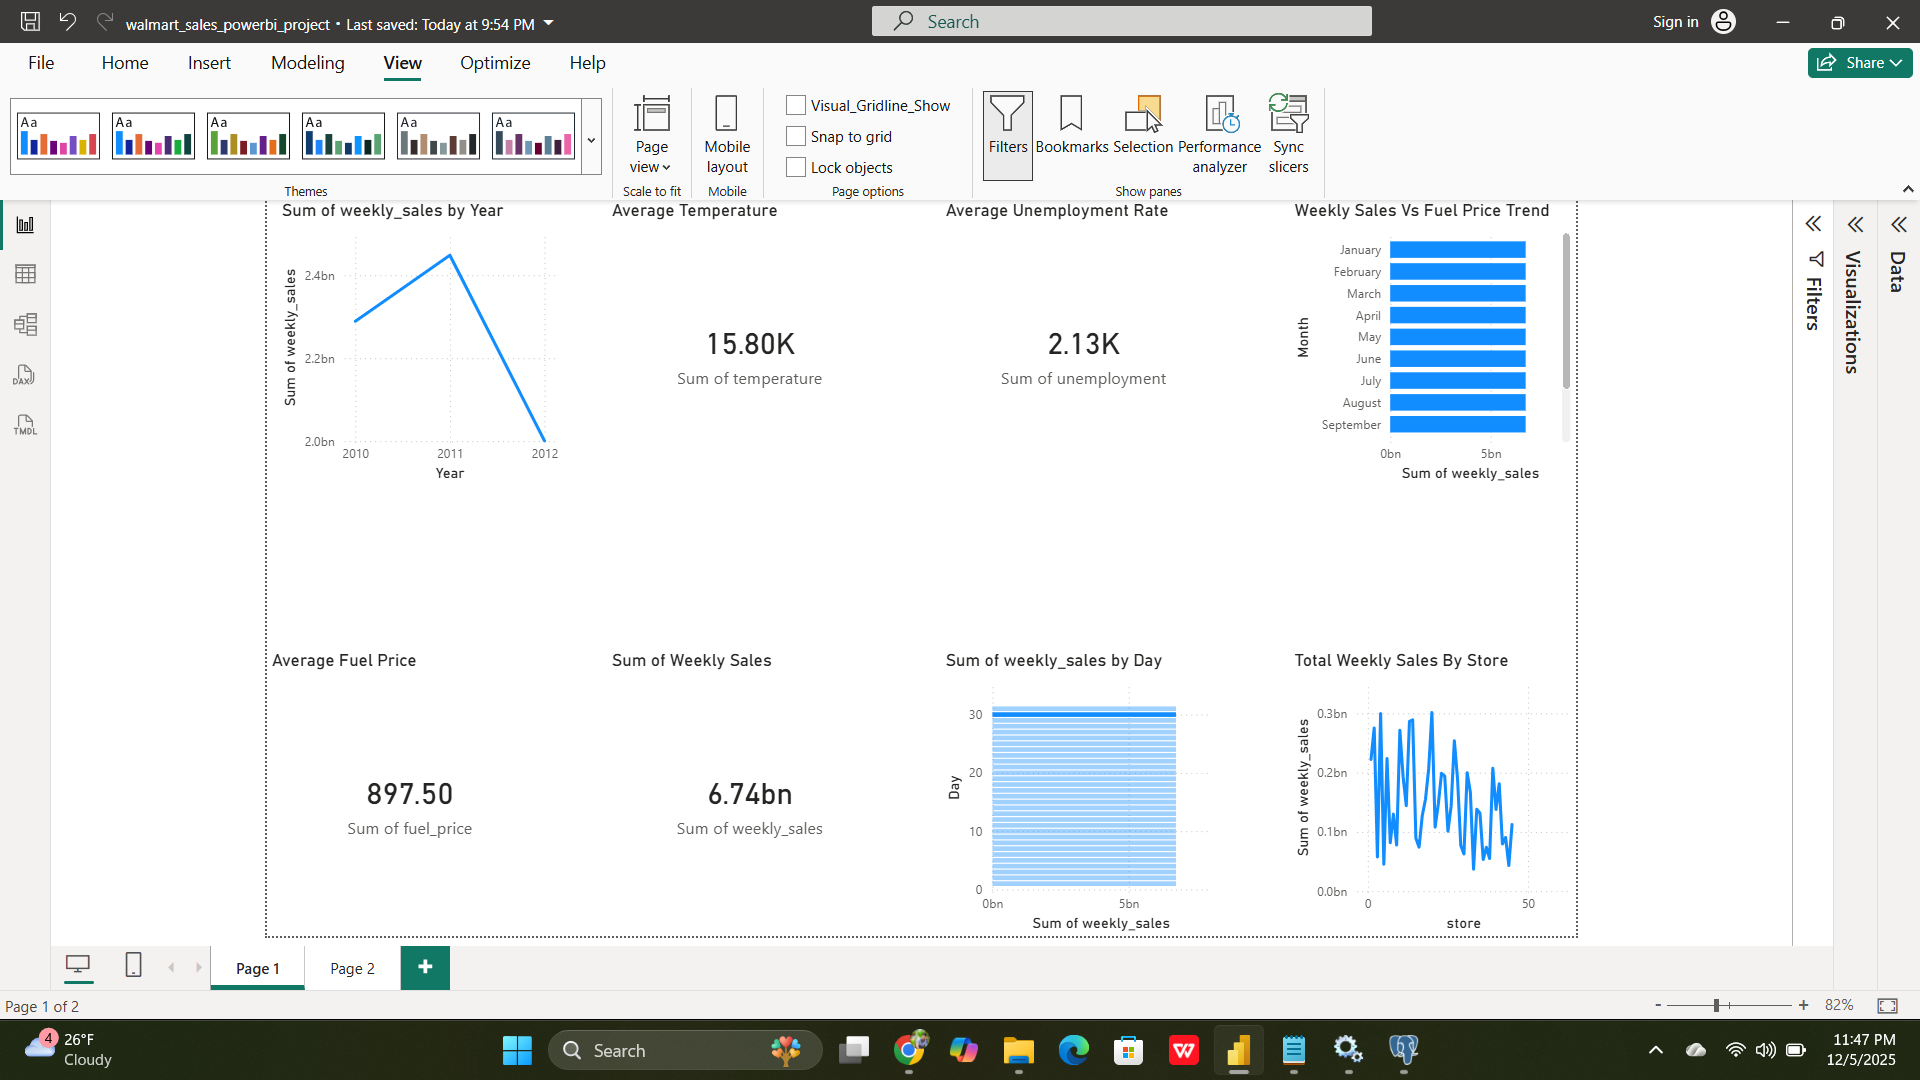 Retail analytics
Designed interactive dashboards to analyse weekly sales, promotions, stores and departments. Implemented data quality checks in SQL and reusable measures to keep reporting consistent.
View GitHub repo →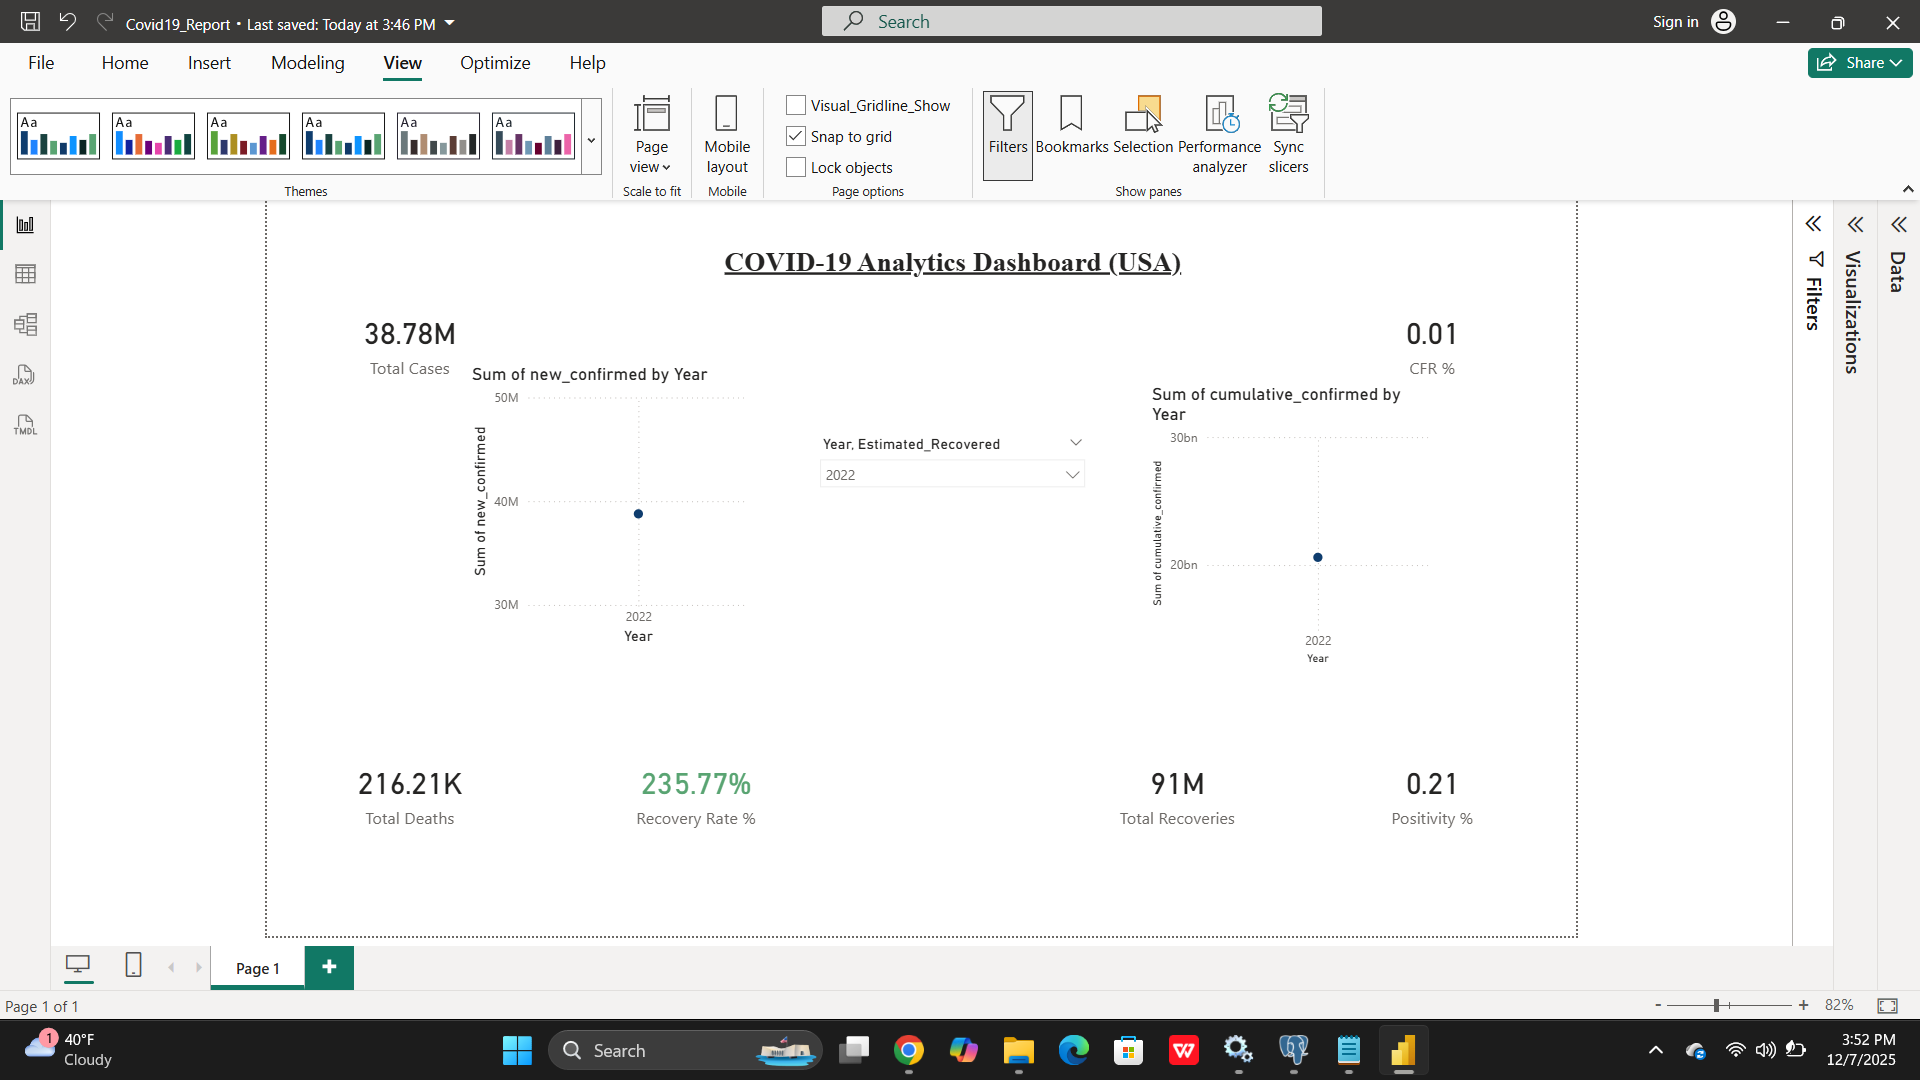 Public health
Built multi-page dashboards on Covid-19 infections, recoveries and deaths across regions. Focused on clear interaction design so non-technical users could explore trends safely.
View GitHub repo →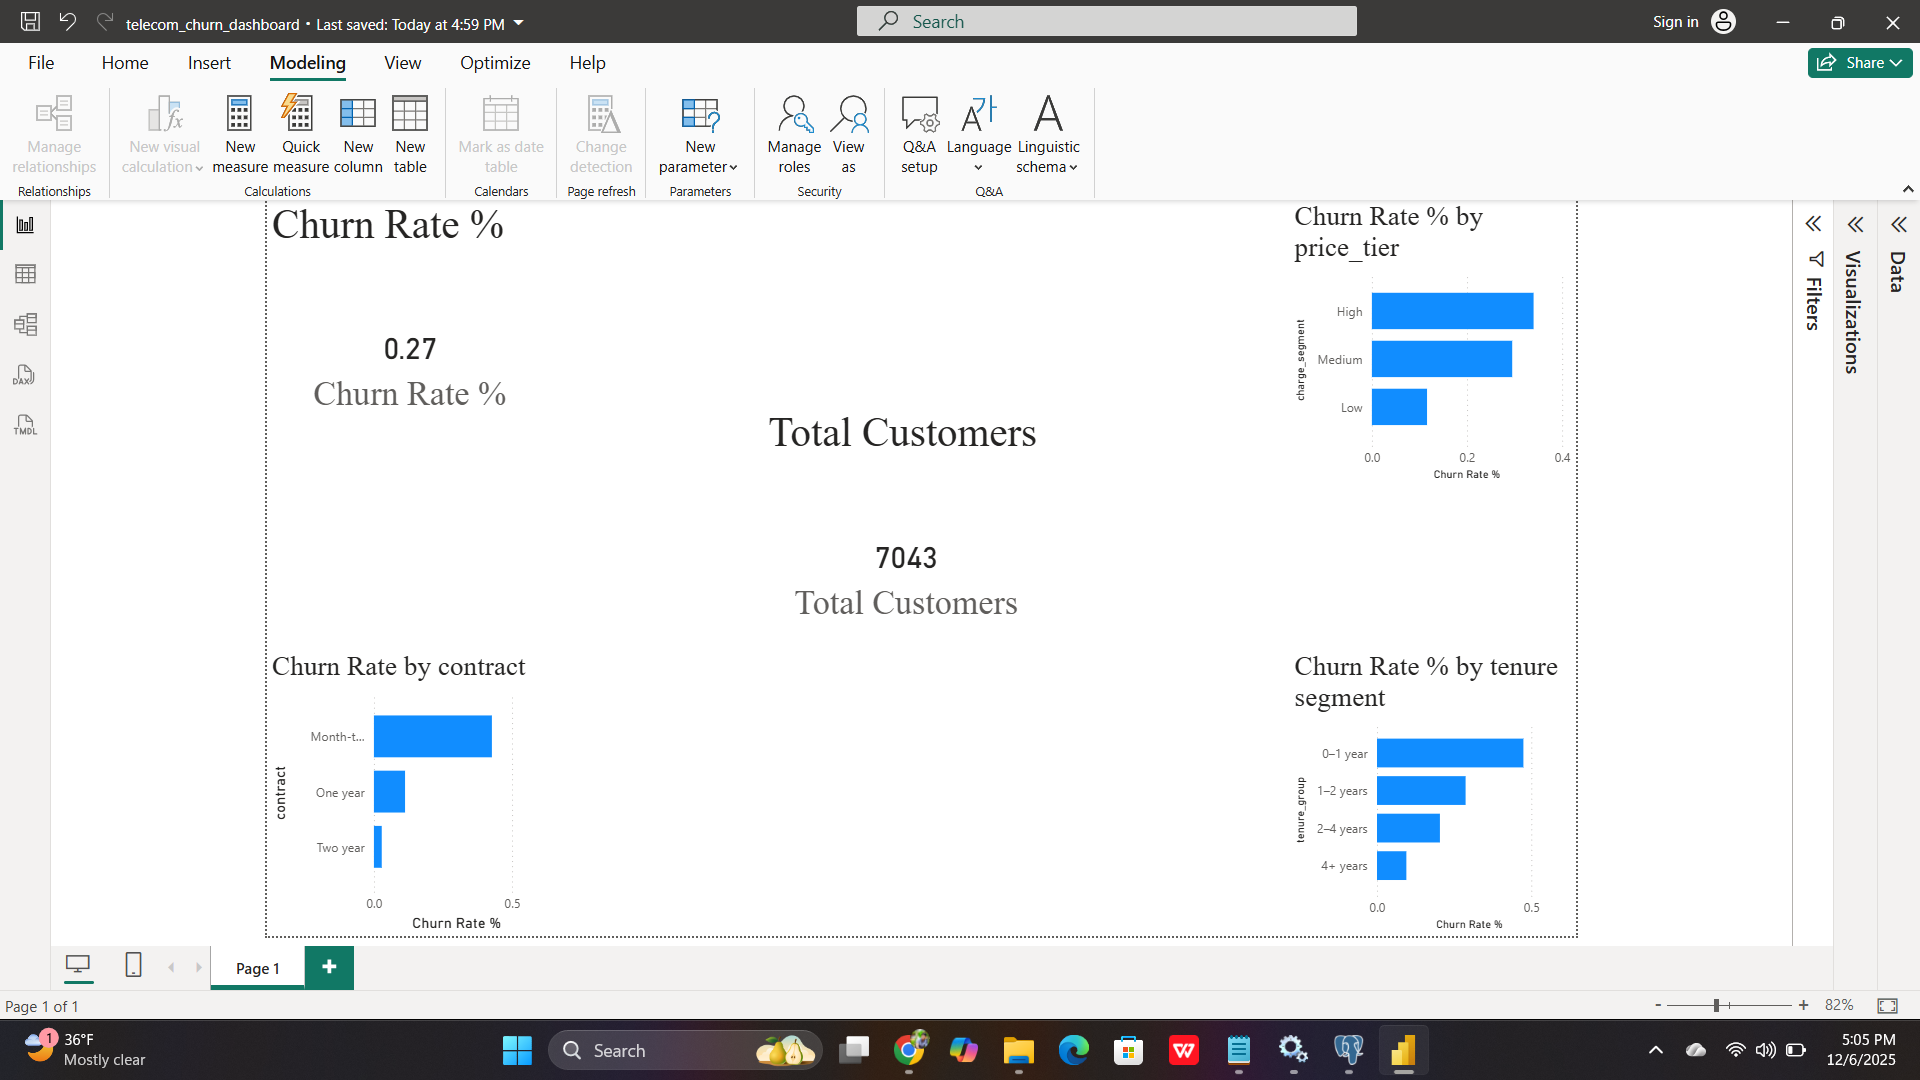 Customer churn
End-to-end telecom churn project covering data modelling, exploratory analysis, churn drivers and dashboards for customer success teams to target at-risk customers.
View GitHub repo →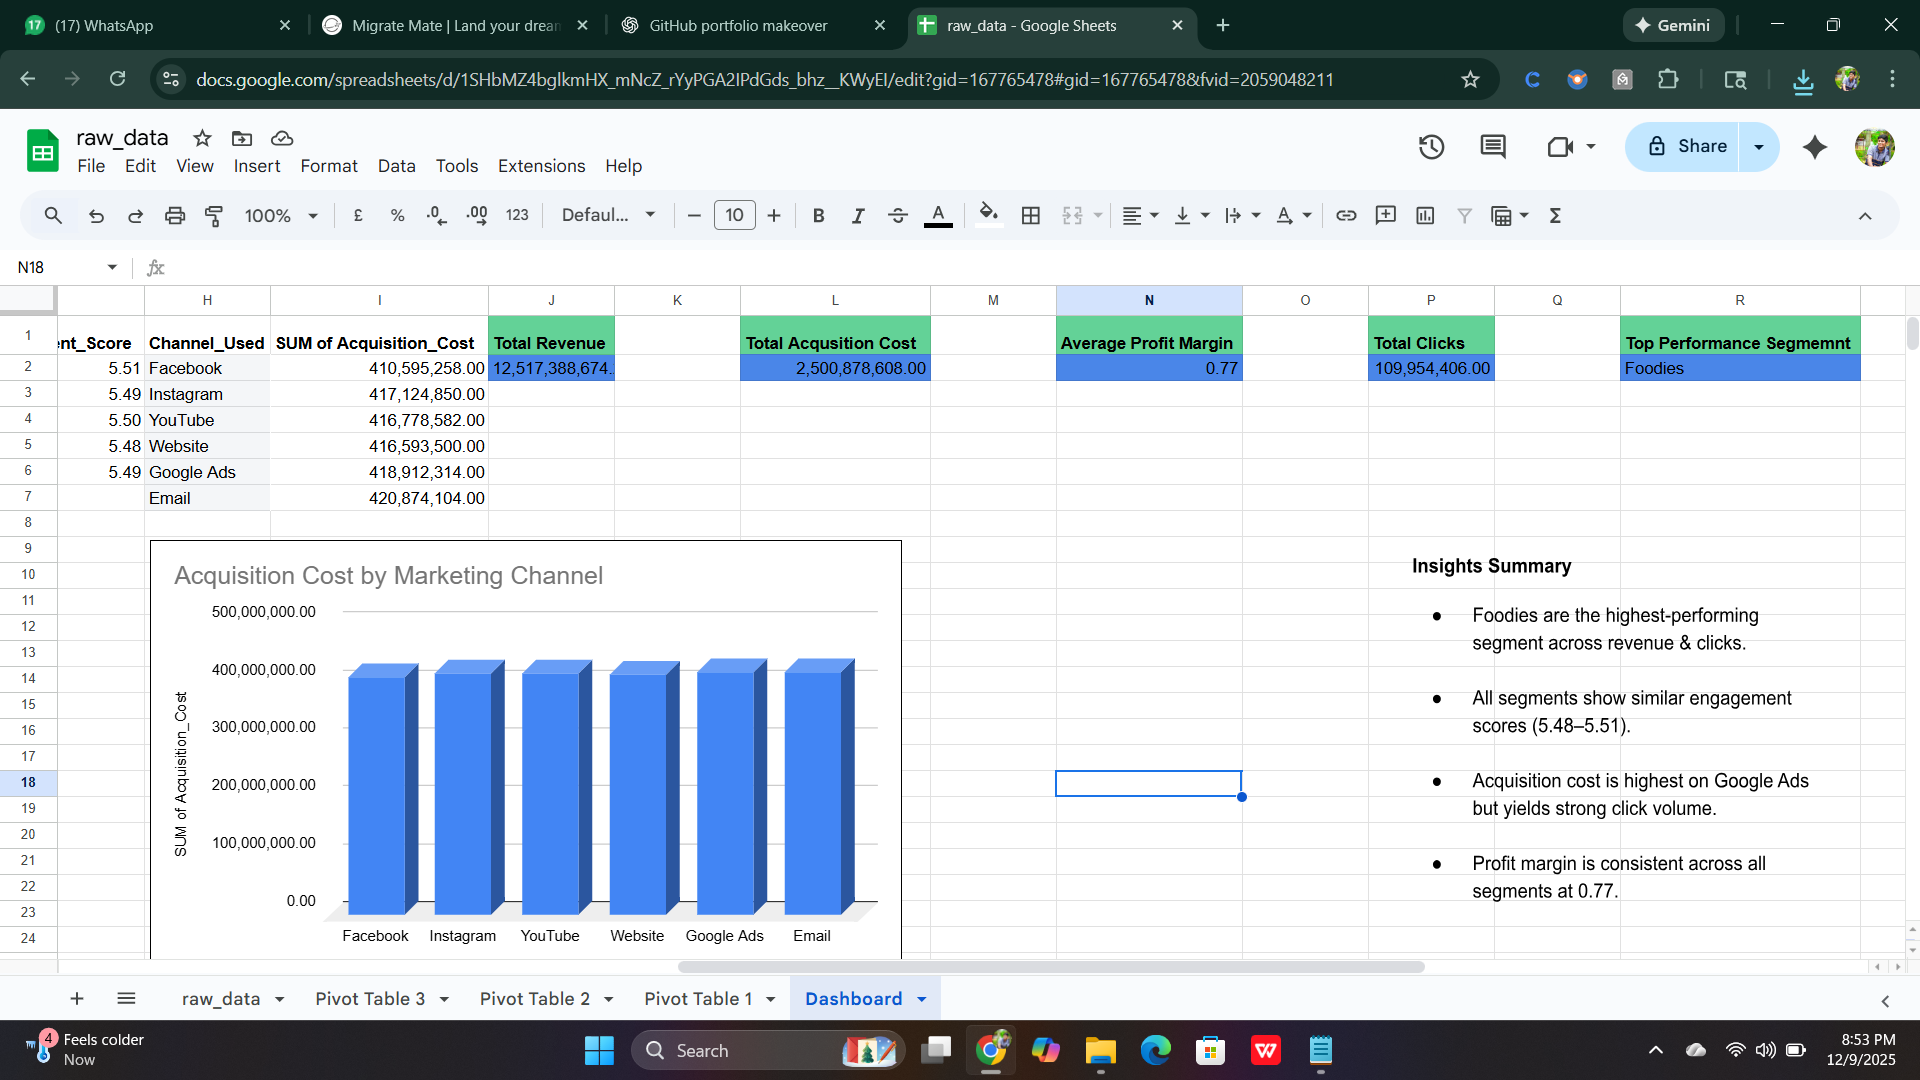 Experimentation
Analysed A/B tests for marketing campaigns using statistical methods to compare variants, estimate lift and communicate results in a business-friendly way.
View GitHub repo →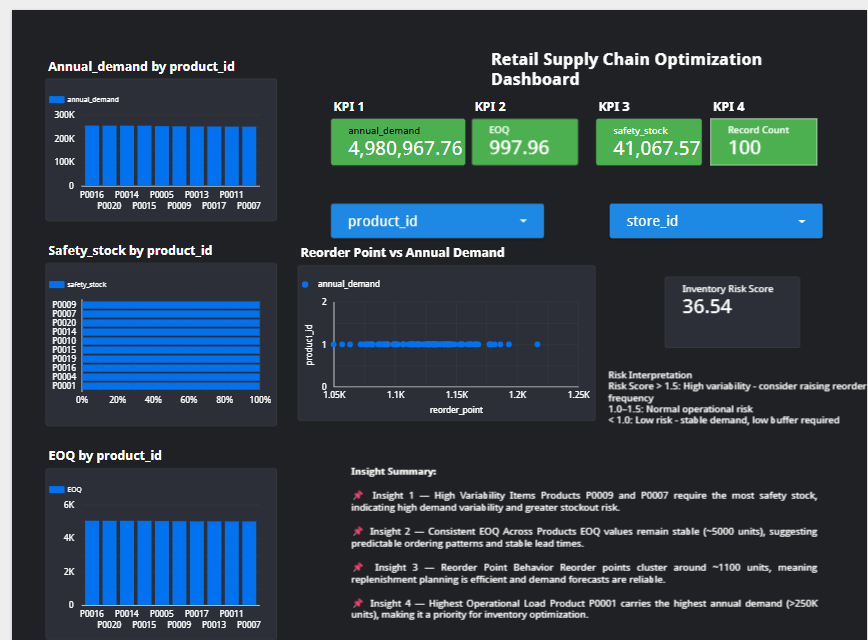 Supply chain
Analysed inventory, lead times and service levels to identify optimisation opportunities in a retail-style supply chain dataset, with dashboards to monitor KPIs.
View GitHub repo →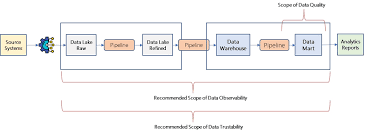 Process improvement
Implemented reusable data quality checks for completeness, duplicates and referential integrity, surfacing results in a status view so teams could fix issues before they hit dashboards.
View GitHub repo →Short, practical posts on data visualisation, advanced analytics and building a portfolio that shows how you think, not just what tools you know.
UX and accessibility techniques I use to make Power BI and Tableau dashboards easy to read, inclusive and decision-ready for busy stakeholders.
READ MORE »A real project walkthrough – from defining the question and data model, to DAX measures, visuals and stakeholder sign-off.
READ MORE »Concrete examples of data quality checks in SQL you can plug into your own pipelines before building reports or models on top.
READ MORE »I’m working on a short, practical series on how to take a raw dataset and turn it into a complete analytics project – from SQL and data quality to UX/UI and advanced analytics.
If you’d like early access to templates, queries and walkthrough videos, leave your email below. No spam, just useful data content.
• Defining the problem and success metrics
• Building a robust SQL data model
• Designing dashboards with UX/UI thinking
• Communicating insights with confidence
Have a project, role or idea you’d like to discuss? Share a few details below and I’ll get back to you with how I can help.
You can use this form to outline your data, the tools you’re using and what you’d like to achieve – whether it’s a one-off dashboard, process improvement, or an end-to-end analytics solution.